
STEP:Core Benchmarks[edit | edit source]
z929669's System Specs[edit | edit source]
The following benchmarks were performed under a pure vanilla HRDLC install with varying degrees of STEP:Core v2.2.6 installed by Section. INI settings were maxed, and STEP INI Tweaks were all applied according to the Guide. Each benchmark run represents 202 seconds of the scripted new-game carriage ride and is highly consistent between equal runs (i.e., we should assume a very small margin of error).

Original Benchmarks[edit | edit source]
z929669's System Specs[edit | edit source]
The following benchmarks were performed on the system linked above but for two exceptions:
- My display adapters were Radeon HD-6850 in CrossfireX (2 GPUs)
- I was using my old RAID0 HDD
Benchmark conditions: STEP 2.2.1 Guide
The following table provides means ± standard deviations for:
- GPU temperature
- GPU load
- Dedicated VRAM (on-card memory) - This caps at 1,996 MB on my system due to crossfireX, which adds memory used on BOTH cards. Effective VRAM is still 1 GB.
- System VRAM (swapped-to-system memory) - lower is better, > 500 MB produces moderate/severe stuttering (on my system)
- FPS
The data below are from my system, which is set up with Crossfire2X. This is important, because GPU-z includes RAM from both GPUs, which inflates the reported Dedicated VRAM by a factor of 2. Thus, it can be easily seen below that my card must be a 1 GB card, since my max VRAM below is nearly 2 GB. Notice below where the standard deviation (SD) is rather large for Dedicated VRAM when there the VRAM usage is at peak efficiency (operating below maximum capacity). However, the SD quickly goes down as available VRAM shrinks. This is because VRAM from second to second has nowhere to go but down, when it previously had room to spike upwards due to moments of high demand. As Dedicated VRAM SD decreases, this should correspond to an increase in swapped (System) VRAM, which should beget stuttering or lag during gameplay.
I don't begin to see stuttering until System VRAM begins to consistently hold around 300 MB. Consistency is important here, because it is the frequency of swaps between Dedicated VRAM and System VRAM that will ultimately contribute to stuttering. Although swap frequency is not directly measurable, the System VRAM standard deviation is a handy indicator for assessing the swap frequency. As the mean System-swapped VRAM increases, the standard deviation should steadily increase, which is exactly what can be seen happening below. Note that ideally, the System VRAM should remain near its initial value when running vanilla Skyrim (in my case, approx 85 MB). Specifically, if System VRAM mean and standard deviation remain fairly stable and low, then this indicates that VRAM demands are within the limits of Dedicated VRAM. As demand is increased, VRAM begins to swap with System, and Sytem VRAM mean and standard deviation both begin to increase. This marks the point where VRAM-induced stuttering can happen.
As the GPU becomes VRAM taxed:
- FPS goes down
- Mean-dedicated VRAM consumption increases
- Dedicated VRAM SD increases at first and then decreases as it fills to capacity
- Mean-system VRAM increases
- System VRAM SD increases rapidly as it is relied upon in varying degrees and will theoretically decrease when a ceiling is hit (but stuttering occurs before this point, so it is not of interest here.)
At the point that the mean System VRAM SD begins to noticeably increase, stuttering becomes significant, indicating a high swap frequency.
The relationship between the summary statistics (M & SD) of VRAM measures and FPS is depicted in the following charts. Chart 1 shows trends for VRAM and FPS (the data have been transformed to exaggerate the relationships) with increasing Dedicated VRAM standard deviation, and Chart 2 shows the same trends with increasing System VRAM. This shows the inverse relationship between System VRAM and FPS. Note that GPU load and temperature seem to follow no predictable pattern. In my testing, noticeable stutter began occurring just after installing Section J, and the point along the benchmarking sequence is indicated by the black vertical line.
WARNING
This template is deprecated. Please revise markup to use Template:GallerySimple instead.Increasing Dedicated VRAM Std. Dev.
Increasing System VRAM Mean
WARNING
This template is deprecated. Please revise markup to use Template:GallerySimple instead.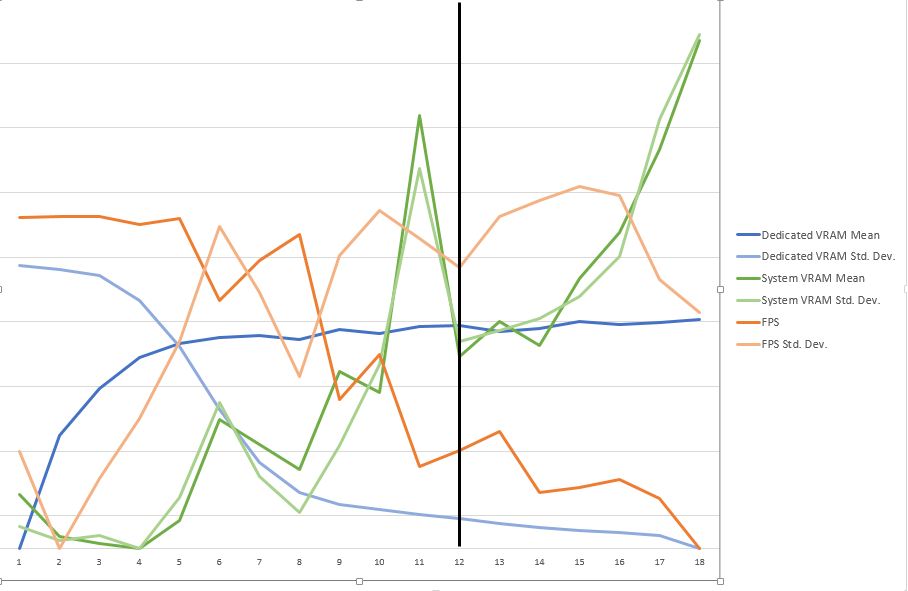
WARNING
This template is deprecated. Please revise markup to use Template:GallerySimple instead.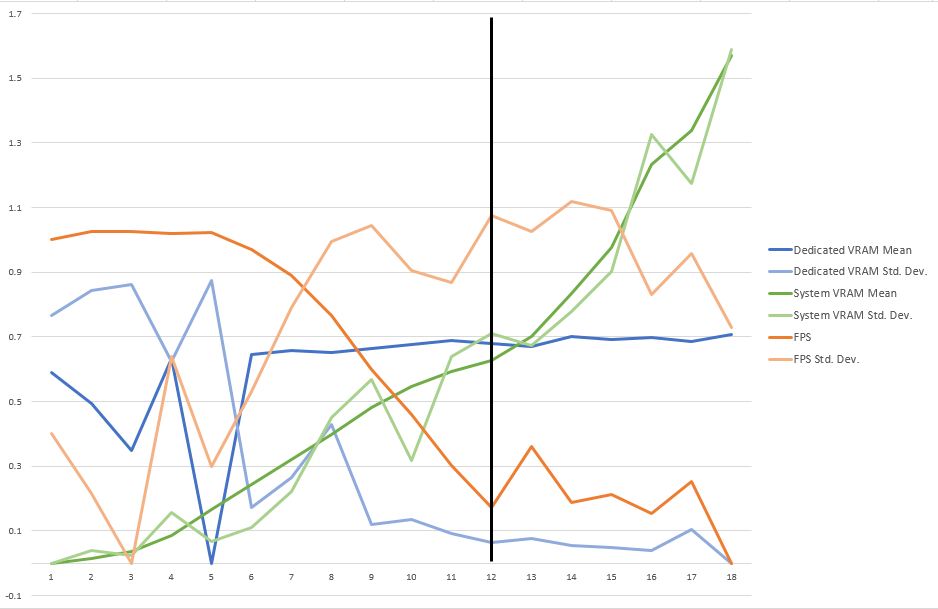
The next set of charts shows the relationship between combined VRAM [Dedicated + System] and FPS for the length of seven of the individual runs (also represented in the table following). Thus, each chart represents an entire 4-minute sequence. First, it is apparent by the repeated patterns that the opening wagon ride serves as a consistent and reliable benchmark. Second, VRAM and FPS are increasingly inversely proportional as the texture load increases through the installation from left to right.
WARNING
This template is deprecated. Please revise markup to use Template:GallerySimple instead.1.F.2 INI Tweaks
2.F Conflicting Graphics
2.G Landscape & Environment
2.I Clothing & Equipment
2.M Gameplay
2.M Gameplay (Single GPU)
2.M Gameplay (Extreme)
WARNING
This template is deprecated. Please revise markup to use Template:GallerySimple instead.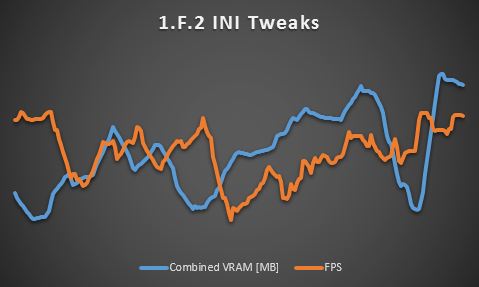
WARNING
This template is deprecated. Please revise markup to use Template:GallerySimple instead.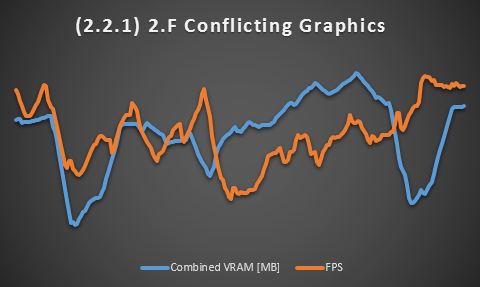
WARNING
This template is deprecated. Please revise markup to use Template:GallerySimple instead.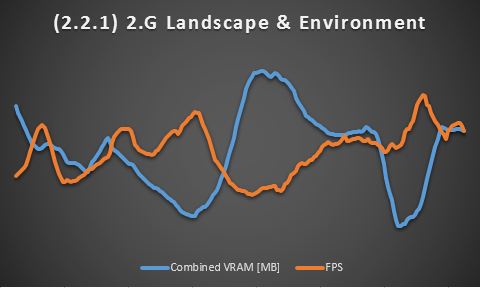
WARNING
This template is deprecated. Please revise markup to use Template:GallerySimple instead.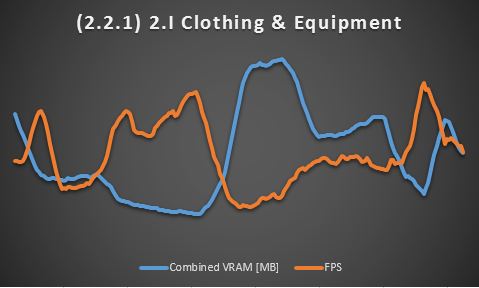
WARNING
This template is deprecated. Please revise markup to use Template:GallerySimple instead.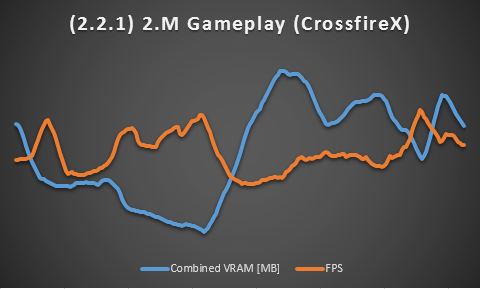
WARNING
This template is deprecated. Please revise markup to use Template:GallerySimple instead.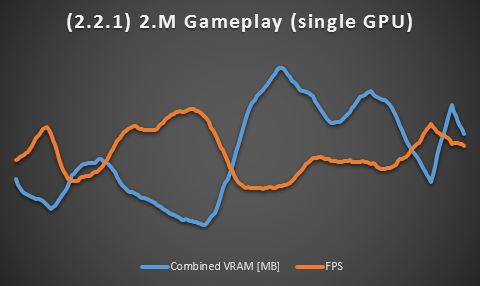
WARNING
This template is deprecated. Please revise markup to use Template:GallerySimple instead.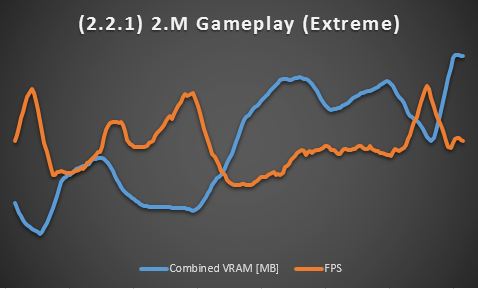
| Assessment | GPU Temp. [?C] | GPU Load [%] | Dedicated VRAM [MB] | System VRAM [MB] | FPS |
|---|---|---|---|---|---|
| Windows background | 52.5 ± 0.7 | 0.5 ± 0.9 | 85.4 ± 8.6 | 32.6 ± 0.5 | n/a |
| (1) Bench 1.F.2 INI Tweaks | 60.4 ± 1.6 | 65.9 ± 7.5 | 1,961.3 ± 21.6 | 89.7 ± 12.6 | 51.5 ± 8.6 |
| (2) Bench 2.D Fixes 1 | 61.1 ± 1.4 | 66.6 ± 7.6 | 1,876.6 ± 64.6 | 85.2 ± 8.0 | 52.7 ± 7.7 |
| (3) Bench 2.D Fixes 2 | 60.2 ± 1.7 | 66.1 ± 7.6 | 1,854.1 ± 78.0 | 91.2 ± 10.3 | 52.5 ± 8.1 |
| (4) Bench 2.E Interface | 61.0 ± 1.5 | 65.7 ± 7.7 | 1,868.4 ± 75.8 | 88.9 ± 7.7 | 52.6 ± 7.5 |
| (5) Bench 2.F Conflicting Graphics 1 | 61.8 ± 1.3 | 67.5 ± 5.9 | 1,918.3 ± 37.8 | 83.7 ± 6.7 | 49.9 ± 8.3 |
| (6) Bench 2.F Conflicting Graphics 2 | 61.0 ± 1.6 | 66.8 ± 6.1 | 1,970.0 ± 18.1 | 93.8 ± 11.2 | 49.0 ± 8.5 |
| (7) Bench 2.G Landscape & Environment 1 | 59.6 ± 1.5 | 69.1 ± 6.8 | 1,975.5 ± 14.8 | 208.0 ± 34.2 | 35.4 ± 11.2 |
| (8) Bench 2.G Landscape & Environment 2 | 59.9 ± 1.6 | 75.7 ± 7.6 | 1,974.9 ± 18.6 | 236.2 ± 35.5 | 32.4 ± 11.3 |
| (9) Bench 2.G Landscape & Environment 3 | 60.0 ± 1.7 | 76.1 ± 7.1 | 1,976.7 ± 16.2 | 231.3 ± 32.7 | 33.6 ± 10.6 |
| (10) Bench 2.G Landscape & Environment 4 | 59.9 ± 1.5 | 76.4 ± 6.6 | 1,972.8 ± 20.2 | 203.0 ± 32.8 | 36.7 ± 10.7 |
| (11) Bench 2.H Characters & Creatures | 59.5 ± 1.6 | 71.0 ± 8.4 | 1,982.8 ± 11.1 | 273.8 ± 62.6 | 33.5 ± 12.0 |
| (12) Bench 2.I Clothing & Equipment | 59.4 ± 1.7 | 75.2 ± 7.6 | 1,979.8 ± 12.6 | 308.9 ± 75.2 | 30.8 ± 10.6 |
| (13) Bench 2.J Animation & Effects | 59.3 ± 1.6 | 69.5 ± 8.8 | 1,979.7 ± 12.0 | 323.4 ± 94.2 | 29.8 ± 11.3 |
| (14) Bench 2.K Clutter & Miscellaneous | 59.4 ± 1.5 | 68.6 ± 8.7 | 1,980.7 ± 10.4 | 369.7 ± 97.9 | 30.4 ± 11.3 |
| (15) Bench 2.L Sound | 59.7 ± 1.3 | 69.3 ± 8.3 | 1,982.2 ± 11.1 | 339.0 ± 96.0 | 30.4 ± 11.6 |
| (16) Bench 2.M Gameplay 1 | 59.9 ± 1.4 | 74.0 ± 7.9 | 1,979.7 ± 14.8 | 386.9 ± 123.1 | 30.8 ± 10.7 |
| (17) Bench 2.M Gameplay 2 | 59.1 ± 1.3 | 68.7 ± 9.1 | 1,982.5 ± 10.3 | 510.2 ± 105.3 | 27.8 ± 10.1 |
| (18) Bench 2.M Gameplay 3 | 60.1 ± 1.0 | 71.6 ± 9.1 | 1,985.2 ± 8.0 | 741.7 ± 218.3 | 26.0 ± 9.8 |
Note that the windows background numbers are included in the first rows. This should be subtracted from all of the data following as a proxy for resources consumed only by Skyrim.
- Bench 1.F.2 INI Tweaks - Performed after 1.F.2, Vanilla HD textures, no optimizations
- Bench 2.D Fixes 1 - Performed after 2.D Fixes, DDSopt (1k-constrained Vanilla textures)
- Bench 2.D Fixes 2 - As previous but also including "Optimized HRDLC" (Vano89)
- Bench 2.E Interface - As previous but performed after 2.E Interface
- Bench 2.F Conflicting Graphics 1 - As previous but performed after 2.F Conflicting Graphics
- Bench 2.F Conflicting Graphics 2 - As previous but also includes DDSopt-ed 2k Skyrim HD & Serious HD (1k-constrained normal maps for all except dungeons)
- Bench 2.G Landscape & Environment 1 - As previous but performed after 2G Landscape & Environment
- Bench 2.G Landscape & Environment 2 - As previous but DDSopt-ed SFO, without constraints
- Bench 2.G Landscape & Environment 3 - As previous but SFO is DDSopt-ed with 1k-constrained normal maps
- Bench 2.G Landscape & Environment 4 - As previous but SFO Diverse Trees disabled
- Bench 2.H Characters & Creatures 4 - As previous but performed after 2.H Characters & Creatures
- Bench 2.I Clothing & Equipment - As previous but Armor and weapons packages DDSopt-ed with 1k-constrained normal maps
- Bench 2.J Animation & Effects - As previous but performed after 2.J Animation & Effects (Stuttering first becomes apparent)
- Bench 2.K Clutter & Miscellaneous - As previous but performed after 2.K Clutter & Miscellaneous
- Bench 2.L Sound - As previous but performed after 2.L Sound
- Bench 2.M Gameplay 1 - As previous but performed after 2.M Gameplay
- Bench 2.M Gameplay 2 - As previous but using 2k versions of DDSopt-ed Skyrim HD & Serious HD (no constraints)
- Bench 2.M Gameplay 3 - As previous but also excluding "Optimized HRDLC" (Vano89) and DDSopt-ed vanilla textures